I absolutely LOVE UltraEdit...since the first day I used it. One of the many things that make this tool so valuable and almost irreplaceable is that of the ability to create your own macros, and the power those macros can have in processing almost any type of file.
I have been working on a project that has a LOT of little things that I have to add all over the place. Becuase of this, I want to create a file with each variable on its own line. The problem originally is that the variables are of variable length and the easiest place that they exist is in a ton of if/else statements. So, I created a macro that, based on copying the if/else block to a new UE document, would create that second file list.
Setup:
1. a document that you want to strip the individual variable names from.
- This document needs to be named and saved.
2. a constant start and stop delimiter for each variable.
- In my case, a dollar sign ($) starts my PHP variable name and a ' =' is directly after the variable name. However, with the power of regexs, you could have a set of acceptable start and stop delimiters, but I have no intention of covering that tonight.
3. a second document in UE that will hold the stripped-out variable.
- This document needs to be named, saved, and directly on the right as listed in the tabs.
To create a new macro in UE, without using the record function, simply follow the mouseclicks here:
Macro->Edit Macro->New Macro
Then give it a name (and a hotkey if you'd like). Once you have done this and clicked OK, you should see the name of your macro in a dropdown bar at the top of the screen as well as the left-side window should be empty.
There are a lot of options in the right-side window that you can select and add to the left-side window. However, for the purposes of this post, simply copy and replace the below lines, and of course modifying for your own search type and expression, should work just fine for anyone.
UE Macro - StripVars
InsertMode
ColumnModeOn
HexOff
PerlReOn
Find RegExp "\$posPl[a-zA-Z]*\ ="
Copy
NextDocument
Paste
Key END
"
"
PreviousDocument
"
"
Some final comments:
- The ColumnModeOn is optional. It just happened to be on when I set this one up.
- PerlReOn: This indicates that the regular expression search on the next line will be using a Perl RegEx. There are other options that can be used instead of Perl RegExs
- The RegExp I am using here should be self-explanatory...but: what I am looking for are all words (only one each time this macro is run) that start with $posPl, has any number of alpha chars, and ends with a space followed by an equals sign. I happen to know that the variables I want are the only words that will match this patter and that this pattern will only match the variables I want.
- The reason to have both documentes already saved with the new doc to the right of the original is for the macro commands of NextDocument and PreviousDocument.
I will leave the figuring out of this macro, additions to such as saving after each stripping of the word and pasting in the new file, to anyone who wants to spend some freetime learning more of this AWESOME tool!!!
Saturday, September 29, 2012
Sunday, September 9, 2012
My thoughts on a new SSL protocol
The prevalence of encrypted traffic on the internet, network LANs/WANs, indicates that more and more people, companies, and even governments are trying to be more proactive in the protection of data. This also makes it harder for network security analyst to sometimes tell the good traffic from the "bad" traffic. If the analyst has authorization and the tools to do so, they can peek at the traffic and see what's going in and out.
However, I don't know that the majority of traffic analysts are authorized or have the tools to tear down these sessions in order to peak into them. There are obviously concerns that span everything from legal to real-time session tear downs that affect the actual session itself. Another concern is cost...how much can an organization spend on appliances that will provide the mechanism to "peek" into the SSL traffic? I would assume that some serious cost-based analysis would have to happen for most organizations.
So, I wonder about the possibility of a new SSL protocol, or something similar. I haven't done any research to see what options have been explored by those smarter than I, so there is a strong possibility that what I am thinking about has already been tried and found wanting. But, here's what I am thinking:
An SSL protocol that utilizes a "secondary transmission" protocol. I am basically proposing that in addition to the normal session initiation, traffic, and ending, that an additional packet be sent that contains the name of the authenticated user and the resource(s) that they are accessing/downloading/uploading/modifying, as well as containing the sequence number of the previous SSL packet, a time of conversation value, and a flag to indicate if an anomaly (such as the username changing mid-conversation).
The transmission of this secondary packet should be based upon some psuedo-random algorithm that makes it harder for a malicious actor to spoof. Additionally, there should be a number of these packets sent and the totality should be based upon an algorithm using information specific to the SSL session itself.
As for the destination of this secondary packet I haven't decided on what I think is best. I am leaning towards a UDP based protocol that sends to the either the same host participating in the SSL conversation or to the localhosts logging (such as 514 syslog on a *nix machine).
Like I stated earlier, this thought may have already been analyzed and found wanting, but I wonder if there isn't something more in general that we can do with SSL to allow for it maintain the privacy it affords (the legal concern), the protection it facilitates, and the durability it needs WHILE supporting a mechanism for auditing its validity.
I would be very interested...after I finish some other stuff in my project queue to attempt to put this into practice. But first, I will definitely spend some time researching what has already, if at all, been attempted.
Passed the GREM exam
I was going to actually post this almost two months ago...when I had actually sat and passed the GREM exam. However, I am kind of glad I didn't as I heard an interesting opinion the other day at lunch.
I don't want to incorrectly attribute a quote that I don't fully remember. That said, I do remember the "gist" of the comment and subsequent conversation: the SANS FOR610 class should be renamed to the "90% malware behavior analysis and 10% reversing malware course." Quite a mouthful, but not necessarily incorrect. I have spent a good deal of time thinking about this statement and the subsequent conversation, which also led me to think about my certifications (current and possible future ones).
Before anyone jumps on me (although I don't think any of the two people who actually read this thing will get upset about this) - I believe the above statement about a new name for SANS FOR610 is relatively accurate. However, I don't believe that this is a negative thing, which is how I believe the person making the statement was implying.
The reason I believe the statement is accurate is because, having attended a FOR610 session that Lenny Zeltser instructed, it is how the course was taught, at least in my own estimation. Furthermore, while I don't want to put words in Zelter's mouth, I do seem to recall that he favored behavioral analysis prior to doing any actual reversing. This happens to be an approach that I agree with completely. Which is why, although I agree with the "renaming" statement, I believe the course teaches an appropriate and effective approach to the reverse engineering of malware. The statement maker had also stated that using an old, free version of IDA and OllyDbg, was not actually reverse engineering. This is where I started to not agree with this person's assessment.
I should note that the individual making these statements is probably, at least, 500 times more experienced and intelligent than I. Point in fact, I could probably work for this person for quite awhile and still not learn all that he seems to know. However, I think sometimes people take these types of statements, when made by seasoned professionals such as this person, and automatically accept them with a high-level of acceptance. Too often I have seen brand new people to the field of network security take these types of statements as gospel truth and run with them. This is only a personal side concern of mine in that I wish the community of practice did more to spread the knowledge. I think that the blogs and twitter feeds and articles are all great, but I can't help but wonder if there's not more that can be done to help out in our own local communities. But that is not really the point of my thoughts here.
Back to my point here...what I think about the value and name of the GREM certification that is supported by the SANS FOR610 course.
Personally, I feel that the course, at least as it is taught by Zeltser, is rather effective and technically relevant. I also think that of the Certifications I have, I think that the GREM is probably one of the hardest to pass and definitely requires that person either have had some experience in reversing malware or a photographic memory. But I will get back to the certification topic in a minute. First, I wanted to give my impression and opinion of the FOR610 class.
My Opinion of SANS' FOR610
I can't speak highly enough of the efforts that Zeltser has obviously put into the development and upkeep of the course. Furthermore, while I agree with the "90% behavioral analysis and only 10% reverse engineering" statement, I don't think it's derogatory thought at all. Quite the opposite in fact. I think it's an accurate statement in fact...even if my recollection of what Zeltser said about this very thought is incorrect. Why do I think this? It's simple really: It's the best method to reverse engineer malware. Quite frankly, I think it is the best method to reverse engineer most software.
If an analyst were to just start off by throwing the executable into a debugger or decompiler, they might, might, be able to tear down the potentially bad executable and identify what it is doing (going to do). They might even be able to identify it's different branching options given whatever environmental conditions that the executable checks for. However, how many analysts out there are experienced enough to even look at the portions of the code that isn't actually stepped through by the debugger/decompiler? Having been around some others who have claimed to be "reversers", it became obvious that the same thing affected there ability to effectively reverse engineer the software: the shortest path, or, if you like, the path of least resistance. It appears that an assumption that is almost considered criminal NOT to make is the assumption that the code is going to execute the same with little variance. In this case, the analyst runs the risk of missing logical branches that execute only when certain tests are met (or not met even). While an if/else branch may be easy for an analyst to recognize and a jnz call for what it is, I believe that the possibility abounds for complacent and/or inexperienced analyst to miss crucial operations of the code when they don't at first spend some time examining the behavior of the potentially malicious executable. Thus, I adhere to a belief that the initial efforts to reverse any software, not even just malware, must start with a behavioral analysis. While the 90% metric may not apply to every effort, I think that to be effective AND reliable, an analyst should spend at least 50% on each side of the effort.
I do realize that the reverse engineering "purist" are probably all shaking their heads at this point. And if all analysts were able to take the time to examine each and every line of the executable in question, then I would be shaking my head with them. However, and I think most in the security domain would agree, there is a time factor with reversing malware. Now, while this time factor exists with probably all other types of reverse engineering software, I believe it to be a more crucial factor when one is attempting to reverse malware. Because time is a factor in identifying the actions of malware, I believe that the initial behavioral analysis compliments the need to meet a time demand and get potentially vital information out to the community of practice.
I don't know if I can, or should dig into this topic any more. The bottom line is that I agree with the idea that the FOR610 class leans more heavily towards the behavioral analysis than actual reversing of the code. However, I believe that it must be this way...much like I believe that reverse engineering malware should follow the same approximate breakdown of their efforts.
As I initially mentioned at the start of this post, the passing of the GREM exam as well as the above referenced conversation really got me thinking again about my own current certifications, which ones I wanted to bother keeping, and which ones I still have a personal desire to complete. Coincidentally, I have also had a few conversations with people aspiring to get into the network security realm and/or software engineering.
My own thoughts, and these conversations, have really kind of caused me to change my thinking a little bit. While I have always agreed that a resume and accompanying certs are helpful on job applications but that experience trumps all...I have started to wonder about the possibility of having too many certs. Or, at least the possibility that 'listing' too many certs can be detrimental to a person's job efforts. I don't know what I ultimately think about this...but I am starting to lean towards a desire to keep to myself whatever certs I have and to only provide the list of them when necessary. Which doesn't mean I am done getting some new certs though...there's still a few I want to get and I am 95% sure that I want to go for the GSE in the next year.
PHP warnings about headers and the session_start function
If you read the voluminous amount of information available on the internet, you will learn that the HTTP Header must be sent before any other HTML code is processed. This also includes blank lines. This enforcement by PHP came about with PHP 4.3 and it can cause some headache if you are dealing with sessions and/or header redirects.
I have been working on a PHP site for someone and have actually had to deal with this more than once. The indicator that something is wrong is a 'Warning' message that will be displayed in the browser that looks similar to:
Warning: Cannot modify header information - headers already sent by (output started at /mysite/htdocs/utils/config.php:37) in /mysite/htdocs/controllers/processLogin.php on line 27
For the purposes of this post, the content of these files do not matter so much. However, to be clear about what I do have in my code:
- in config.php, which I use solely for back end DB connections, I have at the top of my file:
session_start();
...
?>
- in processLogin.php, I have:
if ($count == 1) {
$_SESSION['username'] = $myusername;
header("location: ../index.php?p=welcome");
} else {
header("location: ../index.php?p=autherror");
where the first 'header()' statement is the line 27 referenced in the warning message above.
Having the header() function after a session_start() call CAN cause the same warning in certain conditions. The bottom line with this is that at the start of each file where it is needed you should have the session_start() call before anything else, PHP or HTML. However, THIS was NOT my problem.
If you noticed in the 'Warning' line states that the output was started at line 37 of config.php. Interestingly enough, my file only had 32 lines of code, including the opening and closing PHP tags, the closing tag being the 32nd line. What I didn't realize was that I had those extra lines after the closing tag, although I had immediately noticed that the line being reported was a higher number than the lines of code in that file.
So, as you may have guessed, the problem was the blank lines. Even though I had the session_start() at the correct locations, the blank lines were being processed in-between the session_start() and the header() calls, thus violating the standard that the HTML header MUST be the first thing sent for the page.
Wednesday, September 5, 2012
SNORT Rules Cheat Sheet
I like...make that LOVE...cheat sheets and easy-to-use Quick Reference Guides. I like them so much, I make my own when time permits. So, I thought I would share one here. I got tired of looking for the latest location that I stored the latest SNORT manual at on my computer. Although I like to think I am organized, I do know that I am forgetful. So, it is not uncommon for me to forget where I have placed things. My solution was to, like I said already, to create a cheat sheet of SNORT rule options.
This cheat sheet is basically a version 1 document...only slightly past the draft stage. :-) However, it is a fairly good listing and explanation of the different options (as taken straight from the manual), and the base format, of SNORT rules. I welcome any comments, complaints, or suggestions.
The links below are for the both the PDF and PPTX version of the cheat sheet.
Snort Rules Cheat Sheet (PDF Format) Snort Rules Cheat Sheet (PPTX Format)
And....now that I am not trudging through schoolwork until 3 a.m., I can finally get back to working on a desktop app that I started for creating/validating Snort rules. Last time I worked on it, I was about 80% done with the app. However, I had also started thinking about either changing it or forking it to create a tool for the description of a good number (I forget all the protocols I had already addressed) packet standards. I started thinking of it as more of a reference and learning tool for anyone that wants to get started with intrusion detection, or even those who just want a quick desktop app reference guide.
One really, REALLY, cool thing I did already start to add was an event listener for mouse-clicks on the different sections (to include at the bit level) of the packet format displayed. This event listener would create at least one (depending on a few variables) set of statements for tools such as tcpdump (live capture or from file) or tshark (for stripping out from a pcap file those packets an analyst may want to look at more in detail.
I would be greatly interested in any feedback on this idea. I do have a website I am finishing first but I hope to have a release version of this tool, at least as a teaching/reference tool for packets, in the next 2-3 weeks. Not sure if I am going to keep the Snort rule testing part in this as Snort already has this functionality.
Monday, September 3, 2012
Ubuntu 12.04 and VMWare Player
In the last few months I have been swamped...COMPLETELY swamped...with not only my own projects and things around the house but also on projects for other people. Unfortunately, part of my time constraint issues have stemmed from one of my test machines being infected, not one but TWO hard drives failing, and a network connection at home (provided by Comcast) that generally sucks everytime it rains.
Some of the testing I have been working on over the last few months has been a little more frustrating than running across a read-only partition that I posted about earlier. While I absolutely love Ubuntu AND SecurityOnion, I have been rather annoyed as of late with trying to set up a distributed setup of Ubuntu 12.04 (32-bit) virtual machines, in order to do some testing of some newer SO features.
It is first important to note that the installation of SecurityOnion is EASY and FAST and is NOT the cause of my heartache with the testing I am attempting to do. In fact, I am ONLY installing the OS right now and will then move from a base install of the OS to installing the latest/greatest SO version.
The problem is Ubuntu 12.04 itself. I am using a downloaded ISO and VMWare's Player and am now into hour 3 of the install process!!! Unfortunately, I do not have enough time to troubleshoot the issue but I suspect it is nothing more than a slow connection...although I am letting VMware's Easy Intaller run which may also be the culprit. The ISO I am using is coming from a network location and it "appears" as if the installer is trying to ALSO retrieve packages from the repo. This is NOT what I want it to do so I have 'skipped' the retrieval of a LOT of files and was very interested to see the end result. However, the VM is now HUNG at the "Easy Installer's" installation of VMware Tools.
Bottom line: things that are "designed" to help us or make things faster/automated STILL run a high risk of slowing down progress. Some irony though in this process is that the actual SO image (Live CD) is designed with ease/speed of install in mind...and it DOES work!
I have a new plan now:
- perform OS install and NOT use the Easy Installer (for a total of three VMs)
- establish host only network for said VMs
- stress test VMs to identify any performance issues NOT related to IDS tools
- install latest SO version from repo (on all three VMs)
- one to serve as the collection point for data from the other two
In parrallel to the above, I am also going to set up three VMs using the latest SO ISO file (again, one manager and two sensor VMs) and begin testing from there.
FreeBSD Read-Only filesystem...and changing to read-write
I have had some some seriously annoying issues involving time, especially in the last three months. The worst part has been the "little" things that pop up that have caused delays all of the projects I have undertaken during this time. That said, this is the first of a few quick posts that I wanted to make.
Anyway, the primary point of this post is to record the command used to make a FreeBSD system read AND writable when it is read-only. I have been recently testing a FreeBSD system and was very annoyed to find that the system installs as read-only. It really didn't take long to find the right command from the manpage...but putting it here makes it even easier to find later...and maybe helps someone else.
So, if you want to make ALL partitions on a FreeBSD system writable:
#>mount -u -a -o rw
Explanation:
-u means update the current permissions on the selected partitions
-a means all, which in this case means all partitions listed in fstab
-o means options, where you can see I used 'rw'...intuitively this should be understood as "read, write" privileges.
Because I have used -a I do NOT need to list any specific partition (nor required options). The -u also implies that I want the command to update the listed (or fstab-defined) mount points. I have NOT tried this command on any other flavor of linux but I am fairly confident that it is a universal command....mount is NOT a "new" *nix command. :-)
Edited (5 Sep 12): One thing that I didn't think about was the persistence of read-write property. The above command will make your read-only partitions writable, but the next reboot or the next mount command will use the options in the fstab file. To make this change permanent (usually*), you would need to edit:
#> vi /etc/fstab
The format of each line of this file is:
device mountPoint fileSystemType options dump pass#
There are whole chapters of books written about how to use the mount command and fstab files, so I have no intention of rehashing all of that here. The important part here is that the options column be changed from ro (or just 'r') to the desired rw.
I mentioned above that the change to read-write would usually persist upon modification of the /etc/fstab file. However, this is NOT always the case...but I don't have time to write anything more about that. Maybe a future blog post or an another update to this one.
Friday, June 15, 2012
Using Perl for NSLOOKUP from logfiles (Part 1)
Wow! It's been so long since I have put anything on here. Over the last six months I have been a TON of things, aside from the normal long hours at work.
A quick recap of the the past six months:
- Graduated from University of Michigan - Dearborn with my Masters of Science in Software Engineering
- Of course, a MONTH after I walked the stage the school tells me that they screwed up and that I do in fact have to submit a project...grrrr!!!!!!
- Started four different Blog posts that I just haven't perfected enough to post :-(
- Took SANS610 in Orlando and am sitting the GREM exam next week.
- Dad had a heart attack, but he's getting stronger ever day through a life rehab program he is in
- Working on one web-based project with a friend, designing and installing a new small business network for another friend
- Trying to work on two different Android projects, although I haven't found any time in months to even look at what I have so far.
- AND, I want to start trying to help out on the SecurityOnion project (Doug has done such an AWESOME job with this tool and is looking for contributors - link at bottom of post)
In any event, I wanted to talk about a little tool I have been working on. It's a perl script that does two things and produces two output files.
What it does:
- Takes a file as an argument and parses ALL IP address from the file, writing them to "IPAddresses.txt"
- Parses "IPAddresses.txt" and performs an NSLOOKUP (Perl's version) of every address in this file
- The exception is that I have inserted a quick check for 192.168 address space and ignore those addresses. This could be modified to ignore ALL Private IP space, but I really didn't want to do so yet.
- The NSLOOKUP results are written to the file "NewIPLookupResults.txt."
A word of caution for anyone that wants to copy any of this script:
Absolutely NO ERROR CHECKING or validation is done. I am saving this for step 3 of this project.
So, time to break down the script:
The first part of the script takes the first argument, hopefully a log file, and parses out ALL IP addresses, pushing each one into an array. After this is done, a hash is setup that takes the unique values from the array. This hash is then sorted back into a final array.
This final array is then written to the "IPAddresses.txt" file, one address per line.
>> code begin <<
open MFILE, ">", "IPAddresses.txt" or die $!;
### This allows for the first passed parameter to be used
### in the loop
# Input: the first paramter passed
my @holder = ();
while(<>) {
push(@holder, "$1\n") if /\D(\d+\.\d+\.\d+\.\d+)\D/;
}
#using a hash to weed out the dups
%listTemp = map { $_ => 1 } @holder;
@list_out = sort keys %listTemp;
for my $ipa (@list_out) {
print MFILE $ipa;
}
close(MFILE);
>> end code
That is the "easy" part of this script. The next section deals with getting the NSLOOKUP results using the perl library NET::NSLOOKUP. If you don't have this module installed, you will need to do so before running the remaining part of this script. Additionally, another GREAT library is probably going to need to be installed, NET::DNS, as NSLOOKUP depends upon this.
I will explain this part of the script below the pasting of it.
>> begin code <<
print "Processing NSLOOKUP of IP addresses\n";
open MFILE4, "<", "IPAddresses.txt" or die $!;
@lines =;
print "Output file is NewIPLookupResults.txt\n";
open MFILE3, ">", "NewIPLookupResults.txt" or die $!;
for my $line (@lines) {
#next here if private IP space?
if($line =~ m/[1][9][2]/ )
{
next;
}
print "Performing NSLOOKUP for all IP adresses found in IPAddresses.txt\n\n";
print MFILE3 "///////////////////////////////////////////////////\n";
print MFILE3 "\t\tNSLOOKUP For: " . $line;
print "Working on " . $line . "\n";
print "Starting with A Records\n";
print MFILE3 "**************** A Records: ****************\n";
my @results = nslookup(domain => $line, type => "A");
if (@results == 0)
{
print MFILE3 "\tNo A Records Found\n";
}
for my $res (@results) {
print MFILE3 $res . "\n";
}
print "Now for PTR records\n";
print MFILE3 "**************** PTR Records: ****************\n";
my @results = nslookup(domain => $line, type => "PTR");
if (@results == 0)
{
print MFILE3 "\tNo PTR Records Found\n";
}
for my $res (@results) {
print MFILE3 $res . "\n";
}
print "Now for CNAME records\n";
print MFILE3 "**************** CNAME Records: ****************\n";
my @results = nslookup(domain => $line, type => "CNAME");
if (@results == 0)
{
print MFILE3 "\tNo CNAME Records Found\n";
}
for my $res (@results) {
print MFILE3 $res . "\n";
}
print "Now for MX records\n";
print MFILE3 "**************** MX Records: ****************\n";
my @results = nslookup(domain => $line, type => "MX");
if (@results == 0)
{
print MFILE3 "\tNo MX Records Found\n";
}
for my $res (@results) {
print MFILE3 $res . "\n";
}
print "Now for NS records\n";
print MFILE3 "**************** NS Records: ****************\n";
my @results = nslookup(domain => $line, type => "NS");
if (@results == 0)
{
print MFILE3 "\tNo NS Records Found\n";
}
for my $res (@results) {
print MFILE3 $res . "\n";
}
print "Now for SOA records\n";
print MFILE3 "**************** SOA Records: ****************\n";
my @results = nslookup(domain => $line, type => "SOA");
if (@results == 0)
{
print MFILE3 "\tNo SOA Records Found\n";
}
for my $res (@results) {
print MFILE3 $res . "\n";
}
print "Now for TXT records\n";
print MFILE3 "**************** TXT Records: ****************\n";
my @results = nslookup(domain => $line, type => "TXT");
if (@results == 0)
{
print MFILE3 "\tNo TXT Records Found\n";
}
for my $res (@results) {
print MFILE3 $res . "\n";
}
print MFILE3 "\n";
}
close(MFILE3);
close(MFILE4);
>> end code <<
And, minus the she-bang and use statements, that's the full script. This second part here was a lot more fun to work on than the first. I had never used perl's NSLOOKUP before today so I had a little fun with it which is the primary reason why I do a lookup for every possible record type that this library supports.
You might notice a LOT of print statements, both to the file MFILE3 as well as to STDOUT. I will change this as I tweak this tool and add the features I still want. However, right now I wanted as much verbosity as possible. That said, this script will print to STDOUT an output similar to:
>> Example Output <<
Working on 83.149.8.208
Starting with A Records
Now for PTR records
Now for CNAME records
Now for MX records
Now for NS records
Now for SOA records
Now for TXT records
>> end example output <<
The corresponding output that is written to the file is also somewhat verbose, or at least "pretty" if you like different symbols. :-)
>> Example File Output <<
///////////////////////////////////////////////////
NSLOOKUP For: 83.149.8.208
**************** A Records: ****************
No A Records Found
**************** PTR Records: ****************
gprs-client-83.149.8.208.misp.ru
**************** CNAME Records: ****************
No CNAME Records Found
**************** MX Records: ****************
No MX Records Found
**************** NS Records: ****************
No NS Records Found
**************** SOA Records: ****************
No SOA Records Found
**************** TXT Records: ****************
No TXT Records Found
>> end example output <<
Only a portion of this section needs to be explained as the different checks are identical in nature.
First, I grab the file I just created:
open MFILE4, "<", "IPAddresses.txt" or die $!;
I copy this file to array:
@lines =;
Created a new file for the NSLOOKUP results:
open MFILE3, ">", "NewIPLookupResults.txt" or die $!;
The script now loops through each address in the array. If the address belongs to the 192.168 space, then that line is ignored and the loop goes to the next line.
for my $line (@lines) {
#next here if private IP space?
if($line =~ m/[1][9][2]\.[1][6][8]/ )
{
next;
}
Just some printed information for the file and STDOUT
print "Performing NSLOOKUP for all IP adresses found in IPAddresses.txt\n\n";
print MFILE3 "///////////////////////////////////////////////////\n";
print MFILE3 "\t\tNSLOOKUP For: " . $line;
print "Working on " . $line . "\n";
print "Starting with A Records\n";
print MFILE3 "**************** A Records: ****************\n";
Now, the part I really like, even as simple as it is (Which is WHY I like it because it yet again demonstrates the power that a simple script can have!!!)
Here, I create an array called results that holds the return value of the nslookup function. This function takes two arguments, the first being a 'target' of some kind. This can be domain, host, etc. The second argument is the type of record we want to look for: A, MX, SOA, etc.
my @results = nslookup(domain => $line, type => "A");
#If NO results, then print that and move on
if (@results == 0)
{
print MFILE3 "\tNo A Records Found\n";
}
for my $res (@results) {
print MFILE3 $res . "\n";
}
and that's really all this script does. However, it does ALSO provide a good framework for the beginnings of a multi-purpose tool for pentesters and intrusion detection analysts.
Path Forward:
I plan to make some changes over the next month, as time permits. I would like to make this a little more OO-like in that the NSLOOKUP section is one function, and other tools/sections that I want to add are also functions. These I plan to make 'active' during the scripts running via command line parameters.
Being that I work in network security, and have for a long time, I would be remiss if I didn't eventually add some code to handle errors and input, especially in terms of the files being passed as input as well as the IP address (valid, non-routed, etc). However, I can already 'see' the need for some custom switches, such as WHICH DNS records to actually get or how verbose the file or output needs to be for the user.
The final to things that I want to be able to do with this, after adding any other functionality that I think this needs without bloating it too much are:
- different output formats (how great would it be if I made this importable into the MetaSploit database!!!)
- The ability to parse files such as nmaps greppable or XML output and do more than just DNS lookups.
Unrelated and shamless promotion of an AWESOME TOOL from Doug Burks, SecurityOnion:
Google group:
http://code.google.com/p/security-onion/
http://securityonion.blogspot.com/
A quick recap of the the past six months:
- Graduated from University of Michigan - Dearborn with my Masters of Science in Software Engineering
- Of course, a MONTH after I walked the stage the school tells me that they screwed up and that I do in fact have to submit a project...grrrr!!!!!!
- Started four different Blog posts that I just haven't perfected enough to post :-(
- Took SANS610 in Orlando and am sitting the GREM exam next week.
- Dad had a heart attack, but he's getting stronger ever day through a life rehab program he is in
- Working on one web-based project with a friend, designing and installing a new small business network for another friend
- Trying to work on two different Android projects, although I haven't found any time in months to even look at what I have so far.
- AND, I want to start trying to help out on the SecurityOnion project (Doug has done such an AWESOME job with this tool and is looking for contributors - link at bottom of post)
In any event, I wanted to talk about a little tool I have been working on. It's a perl script that does two things and produces two output files.
What it does:
- Takes a file as an argument and parses ALL IP address from the file, writing them to "IPAddresses.txt"
- Parses "IPAddresses.txt" and performs an NSLOOKUP (Perl's version) of every address in this file
- The exception is that I have inserted a quick check for 192.168 address space and ignore those addresses. This could be modified to ignore ALL Private IP space, but I really didn't want to do so yet.
- The NSLOOKUP results are written to the file "NewIPLookupResults.txt."
A word of caution for anyone that wants to copy any of this script:
Absolutely NO ERROR CHECKING or validation is done. I am saving this for step 3 of this project.
So, time to break down the script:
The first part of the script takes the first argument, hopefully a log file, and parses out ALL IP addresses, pushing each one into an array. After this is done, a hash is setup that takes the unique values from the array. This hash is then sorted back into a final array.
This final array is then written to the "IPAddresses.txt" file, one address per line.
>> code begin <<
open MFILE, ">", "IPAddresses.txt" or die $!;
### This allows for the first passed parameter to be used
### in the loop
# Input: the first paramter passed
my @holder = ();
while(<>) {
push(@holder, "$1\n") if /\D(\d+\.\d+\.\d+\.\d+)\D/;
}
#using a hash to weed out the dups
%listTemp = map { $_ => 1 } @holder;
@list_out = sort keys %listTemp;
for my $ipa (@list_out) {
print MFILE $ipa;
}
close(MFILE);
>> end code
That is the "easy" part of this script. The next section deals with getting the NSLOOKUP results using the perl library NET::NSLOOKUP. If you don't have this module installed, you will need to do so before running the remaining part of this script. Additionally, another GREAT library is probably going to need to be installed, NET::DNS, as NSLOOKUP depends upon this.
I will explain this part of the script below the pasting of it.
>> begin code <<
print "Processing NSLOOKUP of IP addresses\n";
open MFILE4, "<", "IPAddresses.txt" or die $!;
@lines =
print "Output file is NewIPLookupResults.txt\n";
open MFILE3, ">", "NewIPLookupResults.txt" or die $!;
for my $line (@lines) {
#next here if private IP space?
if($line =~ m/[1][9][2]/ )
{
next;
}
print "Performing NSLOOKUP for all IP adresses found in IPAddresses.txt\n\n";
print MFILE3 "///////////////////////////////////////////////////\n";
print MFILE3 "\t\tNSLOOKUP For: " . $line;
print "Working on " . $line . "\n";
print "Starting with A Records\n";
print MFILE3 "**************** A Records: ****************\n";
my @results = nslookup(domain => $line, type => "A");
if (@results == 0)
{
print MFILE3 "\tNo A Records Found\n";
}
for my $res (@results) {
print MFILE3 $res . "\n";
}
print "Now for PTR records\n";
print MFILE3 "**************** PTR Records: ****************\n";
my @results = nslookup(domain => $line, type => "PTR");
if (@results == 0)
{
print MFILE3 "\tNo PTR Records Found\n";
}
for my $res (@results) {
print MFILE3 $res . "\n";
}
print "Now for CNAME records\n";
print MFILE3 "**************** CNAME Records: ****************\n";
my @results = nslookup(domain => $line, type => "CNAME");
if (@results == 0)
{
print MFILE3 "\tNo CNAME Records Found\n";
}
for my $res (@results) {
print MFILE3 $res . "\n";
}
print "Now for MX records\n";
print MFILE3 "**************** MX Records: ****************\n";
my @results = nslookup(domain => $line, type => "MX");
if (@results == 0)
{
print MFILE3 "\tNo MX Records Found\n";
}
for my $res (@results) {
print MFILE3 $res . "\n";
}
print "Now for NS records\n";
print MFILE3 "**************** NS Records: ****************\n";
my @results = nslookup(domain => $line, type => "NS");
if (@results == 0)
{
print MFILE3 "\tNo NS Records Found\n";
}
for my $res (@results) {
print MFILE3 $res . "\n";
}
print "Now for SOA records\n";
print MFILE3 "**************** SOA Records: ****************\n";
my @results = nslookup(domain => $line, type => "SOA");
if (@results == 0)
{
print MFILE3 "\tNo SOA Records Found\n";
}
for my $res (@results) {
print MFILE3 $res . "\n";
}
print "Now for TXT records\n";
print MFILE3 "**************** TXT Records: ****************\n";
my @results = nslookup(domain => $line, type => "TXT");
if (@results == 0)
{
print MFILE3 "\tNo TXT Records Found\n";
}
for my $res (@results) {
print MFILE3 $res . "\n";
}
print MFILE3 "\n";
}
close(MFILE3);
close(MFILE4);
>> end code <<
And, minus the she-bang and use statements, that's the full script. This second part here was a lot more fun to work on than the first. I had never used perl's NSLOOKUP before today so I had a little fun with it which is the primary reason why I do a lookup for every possible record type that this library supports.
You might notice a LOT of print statements, both to the file MFILE3 as well as to STDOUT. I will change this as I tweak this tool and add the features I still want. However, right now I wanted as much verbosity as possible. That said, this script will print to STDOUT an output similar to:
>> Example Output <<
Working on 83.149.8.208
Starting with A Records
Now for PTR records
Now for CNAME records
Now for MX records
Now for NS records
Now for SOA records
Now for TXT records
>> end example output <<
The corresponding output that is written to the file is also somewhat verbose, or at least "pretty" if you like different symbols. :-)
>> Example File Output <<
///////////////////////////////////////////////////
NSLOOKUP For: 83.149.8.208
**************** A Records: ****************
No A Records Found
**************** PTR Records: ****************
gprs-client-83.149.8.208.misp.ru
**************** CNAME Records: ****************
No CNAME Records Found
**************** MX Records: ****************
No MX Records Found
**************** NS Records: ****************
No NS Records Found
**************** SOA Records: ****************
No SOA Records Found
**************** TXT Records: ****************
No TXT Records Found
>> end example output <<
Only a portion of this section needs to be explained as the different checks are identical in nature.
First, I grab the file I just created:
open MFILE4, "<", "IPAddresses.txt" or die $!;
I copy this file to array:
@lines =
Created a new file for the NSLOOKUP results:
open MFILE3, ">", "NewIPLookupResults.txt" or die $!;
The script now loops through each address in the array. If the address belongs to the 192.168 space, then that line is ignored and the loop goes to the next line.
for my $line (@lines) {
#next here if private IP space?
if($line =~ m/[1][9][2]\.[1][6][8]/ )
{
next;
}
Just some printed information for the file and STDOUT
print "Performing NSLOOKUP for all IP adresses found in IPAddresses.txt\n\n";
print MFILE3 "///////////////////////////////////////////////////\n";
print MFILE3 "\t\tNSLOOKUP For: " . $line;
print "Working on " . $line . "\n";
print "Starting with A Records\n";
print MFILE3 "**************** A Records: ****************\n";
Now, the part I really like, even as simple as it is (Which is WHY I like it because it yet again demonstrates the power that a simple script can have!!!)
Here, I create an array called results that holds the return value of the nslookup function. This function takes two arguments, the first being a 'target' of some kind. This can be domain, host, etc. The second argument is the type of record we want to look for: A, MX, SOA, etc.
my @results = nslookup(domain => $line, type => "A");
#If NO results, then print that and move on
if (@results == 0)
{
print MFILE3 "\tNo A Records Found\n";
}
for my $res (@results) {
print MFILE3 $res . "\n";
}
and that's really all this script does. However, it does ALSO provide a good framework for the beginnings of a multi-purpose tool for pentesters and intrusion detection analysts.
Path Forward:
I plan to make some changes over the next month, as time permits. I would like to make this a little more OO-like in that the NSLOOKUP section is one function, and other tools/sections that I want to add are also functions. These I plan to make 'active' during the scripts running via command line parameters.
Being that I work in network security, and have for a long time, I would be remiss if I didn't eventually add some code to handle errors and input, especially in terms of the files being passed as input as well as the IP address (valid, non-routed, etc). However, I can already 'see' the need for some custom switches, such as WHICH DNS records to actually get or how verbose the file or output needs to be for the user.
The final to things that I want to be able to do with this, after adding any other functionality that I think this needs without bloating it too much are:
- different output formats (how great would it be if I made this importable into the MetaSploit database!!!)
- The ability to parse files such as nmaps greppable or XML output and do more than just DNS lookups.
Unrelated and shamless promotion of an AWESOME TOOL from Doug Burks, SecurityOnion:
Google group:
http://code.google.com/p/security-onion/
http://securityonion.blogspot.com/
Sunday, April 29, 2012
Android Debug Bridge Tutorial
What is the Android Debug Bridge
The Android Debug Bridge, or ADB, is a command line tool
that is part of the SDK. This tool utilizes a client-server model and provides
a mechanism to debug, install and remove software, push and pull files, in
addition to some other tools. These actions are performed against an emulator
(via a daemon) as well as a hardware device connected to a USB port on the
development box. While some options of the ADB can be performed via GUI tools
(if the ADT set is installed in Eclipse), the ADB provides for a larger range
of options as well as a smaller level of granularity.
ADB Architecture
As mentioned above, the ADB utilizes a client-server model
as well as a daemon that is running on the target. Because of this model used
as well as the protocols, it is important to have at least a minimal
understanding of the architecture.
Both the client and server are installed on and operated
from the development box. The server provides the framework for the client to
be able to utilize resources (primarily files) on the development box and the
device that the box is connected to, either an emulator or USB-connected device.
Below are some quick facts about the connections and protocols:
·
The connections are all made via TCP
·
The server listens on port 5037
·
The daemon on both the Emulators and devices
listens on an odd number port in the range of 5555 – 5585
o
The emulator or device will also have a
connection on the next open even numbered port with the same range
Connecting to the Emulator/Device
Now that we have a basic description of the ADB and its
architecture, let’s move into how to actually use the ADB. In this section the
items covered will be: Navigating to the ADB tool, How to identify what
emulators and/or devices are connected to the development machine, connecting
the ADB to a specific device and, some Basic Commands.
Where is the ADB located
The ADB tool is located in the directory where the SDK was
installed at, under the platform-tools directory. If using a Windows machine
and following the installation guide’s examples, the path would be: C:\Program
Files\Android\android-sdk\platform-tools
To get a list of devices that are currently connected the devices parameter can be used to
produce a list of what is connected (Serial number in the format:
-) and what the current state is of every device present.
A device can be in three states in this output:
·
not present – No devices were detected and
nothing will be displayed under the headers
·
offline – the device was connected but has not
finished initializing
·
device – The device is connected, initialized,
and ready to accept connections
Entering the command:
c:\..\..\android-sdk\platform-tools\adb
devices will give you an output similar to the below figure. Shown here are
two emulators with their names and attached status.

Figure 1: adb devices command output example
How to Connect
The primary way to connect to an Android device or emulator
is through the use of one of three command switches: -e, -d, -s
The -d switch is used with USB connected
devices.
The -e switch is
used to direct commands at the only connected emulator. This would not work with the situation shown
in Figure 1 above.
The –s switch is
to direct commands at a specific serial numbered emulator, as shown in this
command:
C:\Program
Files\Android\android-sdk\platform-tools>adb -s emulator-5554 shell
Success of this command is the returned command prompt:
#
The above example is requesting a command shell directly on
the device with the serial number emulator-5554. This is the easiest and most
direct way of connecting to an emulator/device through the use of the adb
command. However, there are commands that are just as simple that allow a developer
to push and pull packages and files and to install/update applications without
the need to interact with the shell after execution.
Post Connection Options
The adb tools provide options for moving files, working with
debugging logs, scripting, and other
basic Linux tasks that can be helpful in the development process. Presented
below is discussion on these topics.
Push and Pull with ADB
As mentioned above the ADB tool provides single commands to
push to and pull from and file from the emulator/device, to include the
installation and removal of software packages. Some examples are presented this
section.
The push and pull adb commands are similar in that they both
require two parameters: the local path and file, and the remote location. The
only difference is that of their order, which is dictated by the command chosen.
The push command “pushes” a file to the specified path on
the emulator or device. The pull command “pulls” a file from the remote device
and stores it at the defined local path. The general format of these two
commands, that might help in remembering the order is that the first parameter the
same question regardless of the command being push or pull. The second does the
same. To put it another way, for the push and pull commands, the first
parameter always answers the question: “from where” while the second parameter
answer the question: “to where”. Examples of both of these:
Command From To
adb
push adb pull
First, let’s use the below command to push a small text file
I made called droidCommands.txt
Figure 2: The adb push command

Figure 3: Verifying the directory listing
In the push
command, I specified the /data/data
directory as the location to place the file. Below demonstrates the commands
(basic Linux commands) that I used to verify the directory and file.
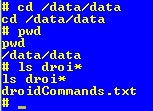
Figure 4: Verifying that file was pushed to proper directory
Pushing and pulling the same file can be a little boring,
not to mention that it appears ambiguous. First, I want to check for any file
that begins with “test” and then rename (Linux mv command) the file to testFileNew.txt.
Figure 5: Renaming the file to pull
To get a file from the device, the adb pull command is used as in the example below.
Figure 6: Example command
of pulling the file from the emulator/device
Installing Software
As with other portions of the ADB that mimic options in the
GUI, there is a mechanism to install a software package to the emulator/device.
The command to install using adb is: install . Notice that
there is no parameter for where the apk is to be installed. All apk files are
automatically placed in the data directory (/data/app/).
In the figures below, shown is the data directory before the installation of
the Amazon mp3 application, the installation from the command line, and the
resulting listing of the directory after the successful installation.
First, a quick directory listing (Linux command ls) prior to installation:

Figure 7: The application directory
Next, after downloading a copy of the Amazon MP3 application
for Android, I run the install command to install the application into the
operating system of the emulator:

Figure 8: Installing the Amazon MP3 Application
After using the adb to install the Amazon MP3 application,
we can verify that it was installed in two ways. First, we can list the application
directory again:

Figure 9: Application directory listing after install
The other way that we can verify that the application was
installed by actually observing it being present in the application listing in
the emulator:

Figure 10: Application present in emulator GUI
Lastly, it is imperative to verify that the application
actually works in the emulator. Otherwise, developers would be only able to verify
the apps are working AFTER it was installed to an actual device. The figure
below shows the installed application open and running.

Figure 11: The application open on the emulator
The ADB debugger acts the same as the GUI instance of logcat. Using options and filters, it
is possible for the developer to garner helpful information about the
application they are working on as well as the device and other processes
running. Of particular interest regarding the logcat tool is that it can be run
from either the ADB command line, or from inside an active shell.
The basic
debugging command in the ADB tool is:
adb logcat
Inside an
active emulator/device shell, the command is:
logcat
The best description of this command comes straight from the
Android Developers website:
[adb] logcat [] ... [
Here, option and filter-spec
are both optional and can be used to create a finer granularity of the results
in the logcat output. Because of the large number of combinations that can be
used, I will only be demonstrating a couple of options that might be helpful to
others.
First, the basic logcat command from the ADB command
line:

Figure 12: adb logcat from the ADB command line
The same logcat command run from inside the emulator shell:

Figure 13: basic logcat command executed inside the emulator
As is shown, both outputs can contain a large amount of data
in a short period of time (screenshots only show approximately 25% of the
output that was captured in approximately 2 seconds). Because of the verbosity of the output, the
options and filters play a crucial part in narrowing the scope of the debugging
information. Some of these options that I have found very helpful are:
Command Result
adb logcat -c
Clears the log buffer
adb logcat -f
<filename> writes
to <filename> instead of stdout
adb logcat -d
dumps
the full logfile to screen and exits
adb logcat
-b view
alternative log buffers (radio, events, main)
The actions
of options -c and -d should not be a surprise to any
developer. Options -f and -b can be very
helpful in a quick fashion and -f
can be used with any of these (and other) options. Some examples are presented
here without screenshots.
-
Dumps the log to the given file. It’s important
to note that you must have write privileges to any directory you are trying to
write the data to if running this command in the emulator/device shell or in
some versions of Linux and Windows machines used for development
adb logcat -b radio (the -f can also be used here)
-
Dumps the radio buffer
D: debug
I: info
W: warning
E: error
F: fatal
S: suppress
Any of these switches can be added to the options already
mentioned. However, there is a specific form for using these levels, known as
priorities. The priority is used in conjunction with a TAG in the format {TAG:PRIORITY}. The TAG represents
where the line(s) in the log came from. An example of this would be Database, which would include any log
line that contains that tag Database.
For instance, to get a logcat dump of only info messages and
above (Info, Warning, Error, and Fatal) that were logged with the TAG
ActivityManager, the following would be used:
adb logcat ActivityManager:I -b radio
To explicitly ignore all lines that do not match the
supplied filter of ActivityManager and Info (and above), the S priority can be
added as in the below example.
adb logcat ActivityManager:I *:S -b radio
Note the usage of the ‘*’.
This wildcard means “all” and will ignore any lines that do not match the
filter.
The final item that needs to be covered is that of the
format of the output. Through all of the examples above, the brief format is the default and is
shown above in Figures 12 and 13. However, there are other formats that are available
and have their definitive uses. The specify a format option for the logcat operation, the -v switch is used
followed by a space and then a format choice from the below options:
Option Output
brief Priority/Tags,
PID, message
process PID, messagetag Priority/Tag, message
raw raw line(s) from log
time Date and invocation time, Priority/Tag, PID, message
threadtime Date and invocation time, Priority/Tag, PID, TID of thread
issuing the message
long All fields with a blank line between each message
adb logcat ActivityManager:I *:S -b radio -v long
Getting State Information
The adb tool provides a mechanism for getting system state
information from the emulator/device. This can be done in three primary ways,
two shell commands (dumpsys and dumpstate) and the logcat command bugreport.
Examples of these commands are below. Dumpsys prints the system information to
the screen. Dumpstate prints all system state information to a file. Bugreport
collects the data from the two shell commands as well as logcat information to
the screen.
adb -s emulator-5554 shell dumpsys
adb -s emulator-5554 shell dumpstate /data/data/sysStateDump.log
logcat bugreport long
it is possible with dumpsys
and bugreport to send the output to
a file instead of the screen through the use of the redirect operator ‘>’ as
seen in earlier examples. For example, to send the bug report to a file in the /data/data directory:
logcat bugreport long > /data/data/bugReport20April2012.log
Other ADB Options
There are some other tasks that the ADB tool can perform.
Although mentioned here, they are not covered in detail in this tutorial. These
other tasks are: starting and stopping the server, forwarding ports (to include
forwarding to a particular jdwp port, using a PPP over USB tunnel, and
generating a full debug report.
Other Help
There are a large number of locations where a developer can
get assistance with using the Android Debug Bridge. The quickest location is the command line
itself:
C:\>adb help
In the emulator/device shell help can be found for logcat as
well:
#logcag --help
Although a search using your favorite search engine will
produce a large number of viable help options in terms of articles and blogs, the
best place on the Web to start is on the Android Developers site itself:
http://developer.android.com/guide/developing/tools/adb.html
Wednesday, January 4, 2012
Android Security with the bookmark_thumb1 directory
My wife has been going through a LOT of hoops with T-Mobile and the piece of trash Sidekick phone that I bought for her. Through all of this, she asked me to look at her microSD card to make sure that there wasn't anything malicious on there.
I had no problem with doing this and it even gave me an excuse to go through six other microSD cards that I haven't looked at in a long time (and it was GOOD that I DID finally look....but that is a whole different subject). So I logged into my box and plugged the microSD card into an adapter and then into the computer. I have looked at almost every file that exists on a microSD used by an Android phone (2.2.1 and earlier) so nothing really stuck out in the file directories. However, one thing DID stick out.
Android uses a folder called .bookmark_thumb1 under the root. I have never been suprised by this folder until the night I was doing this check for my wife, and thus I have NEVER made the time to actually look into the purpose of the folder. Suffice to say that when I glanced at the screenshots that were in this folder, I was very (VERY) annoyed to see the login page for one of my banks as well as all of the login boxes filled in. Now, these were just screenshots, so there was no revelation of the password used even though the username was definitely visible. This caused me to want to look into this folder a little bit.
After getting back to the hotel tonight and still being wired from Michigan's win over Virginia Tech, I thought I would spend five minutes on this. What I have learned:
- The behaviour (taking screenshots of ANY page you visit) is common and actually used by the system in relation to the bookmark maintaining.
- This is not, but "could" be a security risk
- There is both a permenant fix and a temporary fix.
What follows are just a couple steps for the permenant and temporary fixes and some links to some articles already published about this folder.
Temp Fix
After you are done browsing the web (and maybe using some applications), us a file brower (either from the market place or via mounting the SD/microSD card to your laptop) and delete the files or the whole folder. The folder is automatically recreated when a new internet browsing session is initiated.
Permenant Fix
Delete the .bookmark_thumb1 folder. create a blank textfile with the name .bookmark_thumb1. The bookmarking implementation will no longer work properly, but the folder will NOT be recreated and there will be NO more storage of session bookmarks.
Links:
http://www.androidcentral.com/htc-browser-bookmark-images-scare
http://forum.xda-developers.com/showthread.php?t=1230655
http://forums.androidcentral.com/t-inspire-4g/90666-need-help-figuring-out.html
So this isn't a "new" issue...probably isn't an issue to most people. BUT, I did spend a few minutes researching it so it was worth mentioning on here.
Subscribe to:
Posts (Atom)