I was going to actually post this almost two months ago...when I had actually sat and passed the GREM exam. However, I am kind of glad I didn't as I heard an interesting opinion the other day at lunch.
I don't want to incorrectly attribute a quote that I don't fully remember. That said, I do remember the "gist" of the comment and subsequent conversation: the SANS FOR610 class should be renamed to the "90% malware behavior analysis and 10% reversing malware course." Quite a mouthful, but not necessarily incorrect. I have spent a good deal of time thinking about this statement and the subsequent conversation, which also led me to think about my certifications (current and possible future ones).
Before anyone jumps on me (although I don't think any of the two people who actually read this thing will get upset about this) - I believe the above statement about a new name for SANS FOR610 is relatively accurate. However, I don't believe that this is a negative thing, which is how I believe the person making the statement was implying.
The reason I believe the statement is accurate is because, having attended a FOR610 session that Lenny Zeltser instructed, it is how the course was taught, at least in my own estimation. Furthermore, while I don't want to put words in Zelter's mouth, I do seem to recall that he favored behavioral analysis prior to doing any actual reversing. This happens to be an approach that I agree with completely. Which is why, although I agree with the "renaming" statement, I believe the course teaches an appropriate and effective approach to the reverse engineering of malware. The statement maker had also stated that using an old, free version of IDA and OllyDbg, was not actually reverse engineering. This is where I started to not agree with this person's assessment.
I should note that the individual making these statements is probably, at least, 500 times more experienced and intelligent than I. Point in fact, I could probably work for this person for quite awhile and still not learn all that he seems to know. However, I think sometimes people take these types of statements, when made by seasoned professionals such as this person, and automatically accept them with a high-level of acceptance. Too often I have seen brand new people to the field of network security take these types of statements as gospel truth and run with them. This is only a personal side concern of mine in that I wish the community of practice did more to spread the knowledge. I think that the blogs and twitter feeds and articles are all great, but I can't help but wonder if there's not more that can be done to help out in our own local communities. But that is not really the point of my thoughts here.
Back to my point here...what I think about the value and name of the GREM certification that is supported by the SANS FOR610 course.
Personally, I feel that the course, at least as it is taught by Zeltser, is rather effective and technically relevant. I also think that of the Certifications I have, I think that the GREM is probably one of the hardest to pass and definitely requires that person either have had some experience in reversing malware or a photographic memory. But I will get back to the certification topic in a minute. First, I wanted to give my impression and opinion of the FOR610 class.
My Opinion of SANS' FOR610
I can't speak highly enough of the efforts that Zeltser has obviously put into the development and upkeep of the course. Furthermore, while I agree with the "90% behavioral analysis and only 10% reverse engineering" statement, I don't think it's derogatory thought at all. Quite the opposite in fact. I think it's an accurate statement in fact...even if my recollection of what Zeltser said about this very thought is incorrect. Why do I think this? It's simple really: It's the best method to reverse engineer malware. Quite frankly, I think it is the best method to reverse engineer most software.
If an analyst were to just start off by throwing the executable into a debugger or decompiler, they might, might, be able to tear down the potentially bad executable and identify what it is doing (going to do). They might even be able to identify it's different branching options given whatever environmental conditions that the executable checks for. However, how many analysts out there are experienced enough to even look at the portions of the code that isn't actually stepped through by the debugger/decompiler? Having been around some others who have claimed to be "reversers", it became obvious that the same thing affected there ability to effectively reverse engineer the software: the shortest path, or, if you like, the path of least resistance. It appears that an assumption that is almost considered criminal NOT to make is the assumption that the code is going to execute the same with little variance. In this case, the analyst runs the risk of missing logical branches that execute only when certain tests are met (or not met even). While an if/else branch may be easy for an analyst to recognize and a jnz call for what it is, I believe that the possibility abounds for complacent and/or inexperienced analyst to miss crucial operations of the code when they don't at first spend some time examining the behavior of the potentially malicious executable. Thus, I adhere to a belief that the initial efforts to reverse any software, not even just malware, must start with a behavioral analysis. While the 90% metric may not apply to every effort, I think that to be effective AND reliable, an analyst should spend at least 50% on each side of the effort.
I do realize that the reverse engineering "purist" are probably all shaking their heads at this point. And if all analysts were able to take the time to examine each and every line of the executable in question, then I would be shaking my head with them. However, and I think most in the security domain would agree, there is a time factor with reversing malware. Now, while this time factor exists with probably all other types of reverse engineering software, I believe it to be a more crucial factor when one is attempting to reverse malware. Because time is a factor in identifying the actions of malware, I believe that the initial behavioral analysis compliments the need to meet a time demand and get potentially vital information out to the community of practice.
I don't know if I can, or should dig into this topic any more. The bottom line is that I agree with the idea that the FOR610 class leans more heavily towards the behavioral analysis than actual reversing of the code. However, I believe that it must be this way...much like I believe that reverse engineering malware should follow the same approximate breakdown of their efforts.
As I initially mentioned at the start of this post, the passing of the GREM exam as well as the above referenced conversation really got me thinking again about my own current certifications, which ones I wanted to bother keeping, and which ones I still have a personal desire to complete. Coincidentally, I have also had a few conversations with people aspiring to get into the network security realm and/or software engineering.
My own thoughts, and these conversations, have really kind of caused me to change my thinking a little bit. While I have always agreed that a resume and accompanying certs are helpful on job applications but that experience trumps all...I have started to wonder about the possibility of having too many certs. Or, at least the possibility that 'listing' too many certs can be detrimental to a person's job efforts. I don't know what I ultimately think about this...but I am starting to lean towards a desire to keep to myself whatever certs I have and to only provide the list of them when necessary. Which doesn't mean I am done getting some new certs though...there's still a few I want to get and I am 95% sure that I want to go for the GSE in the next year.
Showing posts with label debugging. Show all posts
Showing posts with label debugging. Show all posts
Sunday, September 9, 2012
Sunday, April 29, 2012
Android Debug Bridge Tutorial
What is the Android Debug Bridge
The Android Debug Bridge, or ADB, is a command line tool
that is part of the SDK. This tool utilizes a client-server model and provides
a mechanism to debug, install and remove software, push and pull files, in
addition to some other tools. These actions are performed against an emulator
(via a daemon) as well as a hardware device connected to a USB port on the
development box. While some options of the ADB can be performed via GUI tools
(if the ADT set is installed in Eclipse), the ADB provides for a larger range
of options as well as a smaller level of granularity.
ADB Architecture
As mentioned above, the ADB utilizes a client-server model
as well as a daemon that is running on the target. Because of this model used
as well as the protocols, it is important to have at least a minimal
understanding of the architecture.
Both the client and server are installed on and operated
from the development box. The server provides the framework for the client to
be able to utilize resources (primarily files) on the development box and the
device that the box is connected to, either an emulator or USB-connected device.
Below are some quick facts about the connections and protocols:
·
The connections are all made via TCP
·
The server listens on port 5037
·
The daemon on both the Emulators and devices
listens on an odd number port in the range of 5555 – 5585
o
The emulator or device will also have a
connection on the next open even numbered port with the same range
Connecting to the Emulator/Device
Now that we have a basic description of the ADB and its
architecture, let’s move into how to actually use the ADB. In this section the
items covered will be: Navigating to the ADB tool, How to identify what
emulators and/or devices are connected to the development machine, connecting
the ADB to a specific device and, some Basic Commands.
Where is the ADB located
The ADB tool is located in the directory where the SDK was
installed at, under the platform-tools directory. If using a Windows machine
and following the installation guide’s examples, the path would be: C:\Program
Files\Android\android-sdk\platform-tools
To get a list of devices that are currently connected the devices parameter can be used to
produce a list of what is connected (Serial number in the format:
-) and what the current state is of every device present.
A device can be in three states in this output:
·
not present – No devices were detected and
nothing will be displayed under the headers
·
offline – the device was connected but has not
finished initializing
·
device – The device is connected, initialized,
and ready to accept connections
Entering the command:
c:\..\..\android-sdk\platform-tools\adb
devices will give you an output similar to the below figure. Shown here are
two emulators with their names and attached status.

Figure 1: adb devices command output example
How to Connect
The primary way to connect to an Android device or emulator
is through the use of one of three command switches: -e, -d, -s
The -d switch is used with USB connected
devices.
The -e switch is
used to direct commands at the only connected emulator. This would not work with the situation shown
in Figure 1 above.
The –s switch is
to direct commands at a specific serial numbered emulator, as shown in this
command:
C:\Program
Files\Android\android-sdk\platform-tools>adb -s emulator-5554 shell
Success of this command is the returned command prompt:
#
The above example is requesting a command shell directly on
the device with the serial number emulator-5554. This is the easiest and most
direct way of connecting to an emulator/device through the use of the adb
command. However, there are commands that are just as simple that allow a developer
to push and pull packages and files and to install/update applications without
the need to interact with the shell after execution.
Post Connection Options
The adb tools provide options for moving files, working with
debugging logs, scripting, and other
basic Linux tasks that can be helpful in the development process. Presented
below is discussion on these topics.
Push and Pull with ADB
As mentioned above the ADB tool provides single commands to
push to and pull from and file from the emulator/device, to include the
installation and removal of software packages. Some examples are presented this
section.
The push and pull adb commands are similar in that they both
require two parameters: the local path and file, and the remote location. The
only difference is that of their order, which is dictated by the command chosen.
The push command “pushes” a file to the specified path on
the emulator or device. The pull command “pulls” a file from the remote device
and stores it at the defined local path. The general format of these two
commands, that might help in remembering the order is that the first parameter the
same question regardless of the command being push or pull. The second does the
same. To put it another way, for the push and pull commands, the first
parameter always answers the question: “from where” while the second parameter
answer the question: “to where”. Examples of both of these:
Command From To
adb
push adb pull
First, let’s use the below command to push a small text file
I made called droidCommands.txt
Figure 2: The adb push command

Figure 3: Verifying the directory listing
In the push
command, I specified the /data/data
directory as the location to place the file. Below demonstrates the commands
(basic Linux commands) that I used to verify the directory and file.
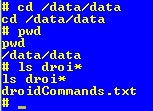
Figure 4: Verifying that file was pushed to proper directory
Pushing and pulling the same file can be a little boring,
not to mention that it appears ambiguous. First, I want to check for any file
that begins with “test” and then rename (Linux mv command) the file to testFileNew.txt.
Figure 5: Renaming the file to pull
To get a file from the device, the adb pull command is used as in the example below.
Figure 6: Example command
of pulling the file from the emulator/device
Installing Software
As with other portions of the ADB that mimic options in the
GUI, there is a mechanism to install a software package to the emulator/device.
The command to install using adb is: install . Notice that
there is no parameter for where the apk is to be installed. All apk files are
automatically placed in the data directory (/data/app/).
In the figures below, shown is the data directory before the installation of
the Amazon mp3 application, the installation from the command line, and the
resulting listing of the directory after the successful installation.
First, a quick directory listing (Linux command ls) prior to installation:

Figure 7: The application directory
Next, after downloading a copy of the Amazon MP3 application
for Android, I run the install command to install the application into the
operating system of the emulator:

Figure 8: Installing the Amazon MP3 Application
After using the adb to install the Amazon MP3 application,
we can verify that it was installed in two ways. First, we can list the application
directory again:

Figure 9: Application directory listing after install
The other way that we can verify that the application was
installed by actually observing it being present in the application listing in
the emulator:

Figure 10: Application present in emulator GUI
Lastly, it is imperative to verify that the application
actually works in the emulator. Otherwise, developers would be only able to verify
the apps are working AFTER it was installed to an actual device. The figure
below shows the installed application open and running.

Figure 11: The application open on the emulator
The ADB debugger acts the same as the GUI instance of logcat. Using options and filters, it
is possible for the developer to garner helpful information about the
application they are working on as well as the device and other processes
running. Of particular interest regarding the logcat tool is that it can be run
from either the ADB command line, or from inside an active shell.
The basic
debugging command in the ADB tool is:
adb logcat
Inside an
active emulator/device shell, the command is:
logcat
The best description of this command comes straight from the
Android Developers website:
[adb] logcat [] ... [
Here, option and filter-spec
are both optional and can be used to create a finer granularity of the results
in the logcat output. Because of the large number of combinations that can be
used, I will only be demonstrating a couple of options that might be helpful to
others.
First, the basic logcat command from the ADB command
line:

Figure 12: adb logcat from the ADB command line
The same logcat command run from inside the emulator shell:

Figure 13: basic logcat command executed inside the emulator
As is shown, both outputs can contain a large amount of data
in a short period of time (screenshots only show approximately 25% of the
output that was captured in approximately 2 seconds). Because of the verbosity of the output, the
options and filters play a crucial part in narrowing the scope of the debugging
information. Some of these options that I have found very helpful are:
Command Result
adb logcat -c
Clears the log buffer
adb logcat -f
<filename> writes
to <filename> instead of stdout
adb logcat -d
dumps
the full logfile to screen and exits
adb logcat
-b view
alternative log buffers (radio, events, main)
The actions
of options -c and -d should not be a surprise to any
developer. Options -f and -b can be very
helpful in a quick fashion and -f
can be used with any of these (and other) options. Some examples are presented
here without screenshots.
-
Dumps the log to the given file. It’s important
to note that you must have write privileges to any directory you are trying to
write the data to if running this command in the emulator/device shell or in
some versions of Linux and Windows machines used for development
adb logcat -b radio (the -f can also be used here)
-
Dumps the radio buffer
D: debug
I: info
W: warning
E: error
F: fatal
S: suppress
Any of these switches can be added to the options already
mentioned. However, there is a specific form for using these levels, known as
priorities. The priority is used in conjunction with a TAG in the format {TAG:PRIORITY}. The TAG represents
where the line(s) in the log came from. An example of this would be Database, which would include any log
line that contains that tag Database.
For instance, to get a logcat dump of only info messages and
above (Info, Warning, Error, and Fatal) that were logged with the TAG
ActivityManager, the following would be used:
adb logcat ActivityManager:I -b radio
To explicitly ignore all lines that do not match the
supplied filter of ActivityManager and Info (and above), the S priority can be
added as in the below example.
adb logcat ActivityManager:I *:S -b radio
Note the usage of the ‘*’.
This wildcard means “all” and will ignore any lines that do not match the
filter.
The final item that needs to be covered is that of the
format of the output. Through all of the examples above, the brief format is the default and is
shown above in Figures 12 and 13. However, there are other formats that are available
and have their definitive uses. The specify a format option for the logcat operation, the -v switch is used
followed by a space and then a format choice from the below options:
Option Output
brief Priority/Tags,
PID, message
process PID, messagetag Priority/Tag, message
raw raw line(s) from log
time Date and invocation time, Priority/Tag, PID, message
threadtime Date and invocation time, Priority/Tag, PID, TID of thread
issuing the message
long All fields with a blank line between each message
adb logcat ActivityManager:I *:S -b radio -v long
Getting State Information
The adb tool provides a mechanism for getting system state
information from the emulator/device. This can be done in three primary ways,
two shell commands (dumpsys and dumpstate) and the logcat command bugreport.
Examples of these commands are below. Dumpsys prints the system information to
the screen. Dumpstate prints all system state information to a file. Bugreport
collects the data from the two shell commands as well as logcat information to
the screen.
adb -s emulator-5554 shell dumpsys
adb -s emulator-5554 shell dumpstate /data/data/sysStateDump.log
logcat bugreport long
it is possible with dumpsys
and bugreport to send the output to
a file instead of the screen through the use of the redirect operator ‘>’ as
seen in earlier examples. For example, to send the bug report to a file in the /data/data directory:
logcat bugreport long > /data/data/bugReport20April2012.log
Other ADB Options
There are some other tasks that the ADB tool can perform.
Although mentioned here, they are not covered in detail in this tutorial. These
other tasks are: starting and stopping the server, forwarding ports (to include
forwarding to a particular jdwp port, using a PPP over USB tunnel, and
generating a full debug report.
Other Help
There are a large number of locations where a developer can
get assistance with using the Android Debug Bridge. The quickest location is the command line
itself:
C:\>adb help
In the emulator/device shell help can be found for logcat as
well:
#logcag --help
Although a search using your favorite search engine will
produce a large number of viable help options in terms of articles and blogs, the
best place on the Web to start is on the Android Developers site itself:
http://developer.android.com/guide/developing/tools/adb.html
Subscribe to:
Posts (Atom)