What is the Android Debug Bridge
The Android Debug Bridge, or ADB, is a command line tool
that is part of the SDK. This tool utilizes a client-server model and provides
a mechanism to debug, install and remove software, push and pull files, in
addition to some other tools. These actions are performed against an emulator
(via a daemon) as well as a hardware device connected to a USB port on the
development box. While some options of the ADB can be performed via GUI tools
(if the ADT set is installed in Eclipse), the ADB provides for a larger range
of options as well as a smaller level of granularity.
ADB Architecture
As mentioned above, the ADB utilizes a client-server model
as well as a daemon that is running on the target. Because of this model used
as well as the protocols, it is important to have at least a minimal
understanding of the architecture.
Both the client and server are installed on and operated
from the development box. The server provides the framework for the client to
be able to utilize resources (primarily files) on the development box and the
device that the box is connected to, either an emulator or USB-connected device.
Below are some quick facts about the connections and protocols:
·
The connections are all made via TCP
·
The server listens on port 5037
·
The daemon on both the Emulators and devices
listens on an odd number port in the range of 5555 – 5585
o
The emulator or device will also have a
connection on the next open even numbered port with the same range
Connecting to the Emulator/Device
Now that we have a basic description of the ADB and its
architecture, let’s move into how to actually use the ADB. In this section the
items covered will be: Navigating to the ADB tool, How to identify what
emulators and/or devices are connected to the development machine, connecting
the ADB to a specific device and, some Basic Commands.
Where is the ADB located
The ADB tool is located in the directory where the SDK was
installed at, under the platform-tools directory. If using a Windows machine
and following the installation guide’s examples, the path would be: C:\Program
Files\Android\android-sdk\platform-tools
To get a list of devices that are currently connected the devices parameter can be used to
produce a list of what is connected (Serial number in the format:
-) and what the current state is of every device present.
A device can be in three states in this output:
·
not present – No devices were detected and
nothing will be displayed under the headers
·
offline – the device was connected but has not
finished initializing
·
device – The device is connected, initialized,
and ready to accept connections
Entering the command:
c:\..\..\android-sdk\platform-tools\adb
devices will give you an output similar to the below figure. Shown here are
two emulators with their names and attached status.

Figure 1: adb devices command output example
How to Connect
The primary way to connect to an Android device or emulator
is through the use of one of three command switches: -e, -d, -s
The -d switch is used with USB connected
devices.
The -e switch is
used to direct commands at the only connected emulator. This would not work with the situation shown
in Figure 1 above.
The –s switch is
to direct commands at a specific serial numbered emulator, as shown in this
command:
C:\Program
Files\Android\android-sdk\platform-tools>adb -s emulator-5554 shell
Success of this command is the returned command prompt:
#
The above example is requesting a command shell directly on
the device with the serial number emulator-5554. This is the easiest and most
direct way of connecting to an emulator/device through the use of the adb
command. However, there are commands that are just as simple that allow a developer
to push and pull packages and files and to install/update applications without
the need to interact with the shell after execution.
Post Connection Options
The adb tools provide options for moving files, working with
debugging logs, scripting, and other
basic Linux tasks that can be helpful in the development process. Presented
below is discussion on these topics.
Push and Pull with ADB
As mentioned above the ADB tool provides single commands to
push to and pull from and file from the emulator/device, to include the
installation and removal of software packages. Some examples are presented this
section.
The push and pull adb commands are similar in that they both
require two parameters: the local path and file, and the remote location. The
only difference is that of their order, which is dictated by the command chosen.
The push command “pushes” a file to the specified path on
the emulator or device. The pull command “pulls” a file from the remote device
and stores it at the defined local path. The general format of these two
commands, that might help in remembering the order is that the first parameter the
same question regardless of the command being push or pull. The second does the
same. To put it another way, for the push and pull commands, the first
parameter always answers the question: “from where” while the second parameter
answer the question: “to where”. Examples of both of these:
Command From To
adb
push adb pull
First, let’s use the below command to push a small text file
I made called droidCommands.txt
Figure 2: The adb push command

Figure 3: Verifying the directory listing
In the push
command, I specified the /data/data
directory as the location to place the file. Below demonstrates the commands
(basic Linux commands) that I used to verify the directory and file.
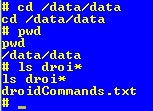
Figure 4: Verifying that file was pushed to proper directory
Pushing and pulling the same file can be a little boring,
not to mention that it appears ambiguous. First, I want to check for any file
that begins with “test” and then rename (Linux mv command) the file to testFileNew.txt.
Figure 5: Renaming the file to pull
To get a file from the device, the adb pull command is used as in the example below.
Figure 6: Example command
of pulling the file from the emulator/device
Installing Software
As with other portions of the ADB that mimic options in the
GUI, there is a mechanism to install a software package to the emulator/device.
The command to install using adb is: install . Notice that
there is no parameter for where the apk is to be installed. All apk files are
automatically placed in the data directory (/data/app/).
In the figures below, shown is the data directory before the installation of
the Amazon mp3 application, the installation from the command line, and the
resulting listing of the directory after the successful installation.
First, a quick directory listing (Linux command ls) prior to installation:

Figure 7: The application directory
Next, after downloading a copy of the Amazon MP3 application
for Android, I run the install command to install the application into the
operating system of the emulator:

Figure 8: Installing the Amazon MP3 Application
After using the adb to install the Amazon MP3 application,
we can verify that it was installed in two ways. First, we can list the application
directory again:

Figure 9: Application directory listing after install
The other way that we can verify that the application was
installed by actually observing it being present in the application listing in
the emulator:

Figure 10: Application present in emulator GUI
Lastly, it is imperative to verify that the application
actually works in the emulator. Otherwise, developers would be only able to verify
the apps are working AFTER it was installed to an actual device. The figure
below shows the installed application open and running.

Figure 11: The application open on the emulator
The ADB debugger acts the same as the GUI instance of logcat. Using options and filters, it
is possible for the developer to garner helpful information about the
application they are working on as well as the device and other processes
running. Of particular interest regarding the logcat tool is that it can be run
from either the ADB command line, or from inside an active shell.
The basic
debugging command in the ADB tool is:
adb logcat
Inside an
active emulator/device shell, the command is:
logcat
The best description of this command comes straight from the
Android Developers website:
[adb] logcat [] ... [
Here, option and filter-spec
are both optional and can be used to create a finer granularity of the results
in the logcat output. Because of the large number of combinations that can be
used, I will only be demonstrating a couple of options that might be helpful to
others.
First, the basic logcat command from the ADB command
line:

Figure 12: adb logcat from the ADB command line
The same logcat command run from inside the emulator shell:

Figure 13: basic logcat command executed inside the emulator
As is shown, both outputs can contain a large amount of data
in a short period of time (screenshots only show approximately 25% of the
output that was captured in approximately 2 seconds). Because of the verbosity of the output, the
options and filters play a crucial part in narrowing the scope of the debugging
information. Some of these options that I have found very helpful are:
Command Result
adb logcat -c
Clears the log buffer
adb logcat -f
<filename> writes
to <filename> instead of stdout
adb logcat -d
dumps
the full logfile to screen and exits
adb logcat
-b view
alternative log buffers (radio, events, main)
The actions
of options -c and -d should not be a surprise to any
developer. Options -f and -b can be very
helpful in a quick fashion and -f
can be used with any of these (and other) options. Some examples are presented
here without screenshots.
-
Dumps the log to the given file. It’s important
to note that you must have write privileges to any directory you are trying to
write the data to if running this command in the emulator/device shell or in
some versions of Linux and Windows machines used for development
adb logcat -b radio (the -f can also be used here)
-
Dumps the radio buffer
D: debug
I: info
W: warning
E: error
F: fatal
S: suppress
Any of these switches can be added to the options already
mentioned. However, there is a specific form for using these levels, known as
priorities. The priority is used in conjunction with a TAG in the format {TAG:PRIORITY}. The TAG represents
where the line(s) in the log came from. An example of this would be Database, which would include any log
line that contains that tag Database.
For instance, to get a logcat dump of only info messages and
above (Info, Warning, Error, and Fatal) that were logged with the TAG
ActivityManager, the following would be used:
adb logcat ActivityManager:I -b radio
To explicitly ignore all lines that do not match the
supplied filter of ActivityManager and Info (and above), the S priority can be
added as in the below example.
adb logcat ActivityManager:I *:S -b radio
Note the usage of the ‘*’.
This wildcard means “all” and will ignore any lines that do not match the
filter.
The final item that needs to be covered is that of the
format of the output. Through all of the examples above, the brief format is the default and is
shown above in Figures 12 and 13. However, there are other formats that are available
and have their definitive uses. The specify a format option for the logcat operation, the -v switch is used
followed by a space and then a format choice from the below options:
Option Output
brief Priority/Tags,
PID, message
process PID, messagetag Priority/Tag, message
raw raw line(s) from log
time Date and invocation time, Priority/Tag, PID, message
threadtime Date and invocation time, Priority/Tag, PID, TID of thread
issuing the message
long All fields with a blank line between each message
adb logcat ActivityManager:I *:S -b radio -v long
Getting State Information
The adb tool provides a mechanism for getting system state
information from the emulator/device. This can be done in three primary ways,
two shell commands (dumpsys and dumpstate) and the logcat command bugreport.
Examples of these commands are below. Dumpsys prints the system information to
the screen. Dumpstate prints all system state information to a file. Bugreport
collects the data from the two shell commands as well as logcat information to
the screen.
adb -s emulator-5554 shell dumpsys
adb -s emulator-5554 shell dumpstate /data/data/sysStateDump.log
logcat bugreport long
it is possible with dumpsys
and bugreport to send the output to
a file instead of the screen through the use of the redirect operator ‘>’ as
seen in earlier examples. For example, to send the bug report to a file in the /data/data directory:
logcat bugreport long > /data/data/bugReport20April2012.log
Other ADB Options
There are some other tasks that the ADB tool can perform.
Although mentioned here, they are not covered in detail in this tutorial. These
other tasks are: starting and stopping the server, forwarding ports (to include
forwarding to a particular jdwp port, using a PPP over USB tunnel, and
generating a full debug report.
Other Help
There are a large number of locations where a developer can
get assistance with using the Android Debug Bridge. The quickest location is the command line
itself:
C:\>adb help
In the emulator/device shell help can be found for logcat as
well:
#logcag --help
Although a search using your favorite search engine will
produce a large number of viable help options in terms of articles and blogs, the
best place on the Web to start is on the Android Developers site itself:
http://developer.android.com/guide/developing/tools/adb.html